Quando tornare a investire in obbligazioni? (1 Viewer)

Rottweiler

Forumer storico
Dopo la conference della Lagarde i bonds europei hanno preso più bruscamente la via della discesa, facendo un falò di tutti i distinguo che illustri analisti avevano fatto, dilungandosi su ipoteticamente decisive diversità di tempo e geografia: " non è più tempo di taper tantrum", "per i bond europei sarà una storia diversa", "è importante essere selettivi", e altre amenità.
I sempliciotti che dicevano "quando si scende scendono tutti, anche se non allo stesso modo" finiscono per aver ragione..

Noi, nel nostro piccolo, cosa diciamo?

Siamo lontani dal bottom? Se sì, di quanto? Settimane? Mesi? Quale segnale cerchiamo, per convincerci che è il momento di rientrare nei bonds (ovviamente bisognerà decidere quali...)?
 

Rottweiler

Forumer storico
Il Weekly di BlackRock e un flash di El-Erian sull'allargamento degli spread dei tds Italia e Grecia...


Schermata 2022-02-08 alle 20.11.48.png
 

Allegati

  • 7 febbraio.pdf
    515,3 KB · Visite: 105

Rottweiler

Forumer storico
Il Research di ABN-AMRO per aiutarci a capire come la BCE si stia sforzando di comunicare con il mercato...

PS: questa settimana questo thread compie 1 mese. Era un tentativo.
L'idea di fondo era quella di raccogliere voci autorevoli (reports, articoli, newsletters, etc.) che ci aiutassero a seguire (e se possibile a prevedere) l'andamento dei tassi, per scegliere il momento migliore di rientro nel mercato obbligazionario.
A giudicare dal numero modestissimo di contributi, si può solo dedurre che questo interesse è quasi solo mio.
Pertanto con il prossimo weekend il tentativo giungerà a termine..
 

Allegati

  • ECB softens pivot - ABN AMRO Bank.pdf
    393,6 KB · Visite: 117
Ultima modifica:

samantaao

Forumer storico
Il Research di ABN-AMRO per aiutarci a capire come la BCE si stia sforzando di comunicare con il mercato...

PS: questa settimana questo thread compie 1 mese. Era un tentativo.
L'idea di fondo era quella di raccogliere voci autorevoli (reports, articoli, newsletters, etc.) che ci aiutassero a seguire (e se possibile a prevedere) l'andamento dei tassi, per scegliere il momento migliore di rientro nel mercato obbligazionario.
A giudicare dal numero modestissimo di contributi, si può solo dedurre che questo interesse è quasi solo mio.
Pertanto con il prossimo weekend il tentativo giungerà a termine..
Mi spiace, io non riesco a contribuire ma leggevo volentieri.
Io ho cominciato a comprare perché credo che con questa inflazione, finiti gli incentivi, anticipati gli investimenti che molte aziende avevano in pancia nel prossimo futuro ci sarà un rallentamento dell'economia... non servirà alzare di tanto i tassi per riequilibrare domanda - offerta
 

locco68

violaforever
Mio modesto contributo:
Il parere di Whitney Tilson sull'inflazione (e pandemia...)


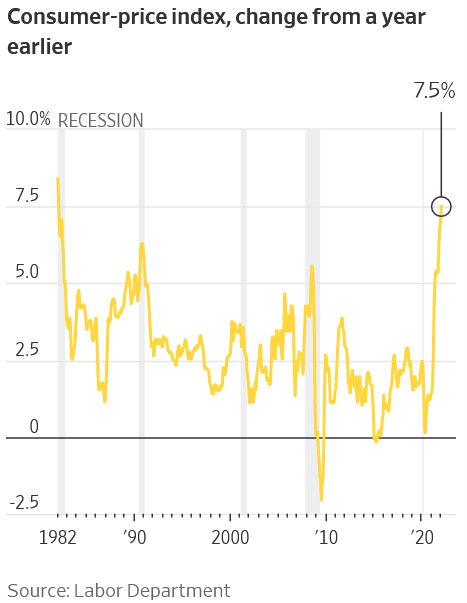
Another month, another scary headline about inflation, like this one in yesterday's Wall Street Journal: U.S. Inflation Rate Accelerates to a 40-Year High of 7.5%. Excerpt:

A relentless surge in U.S. inflation reached another four-decade high last month, accelerating to a 7.5% annual rate as strong consumer demand collided with pandemic-related supply disruptions.
The Labor Department on Thursday said the consumer-price index – which measures what consumers pay for goods and services – in January reached its highest level since February 1982, when compared with the same month a year ago. That put inflation above December's 7% annual rate and well above the 1.8% annual rate for inflation in 2019 ahead of the pandemic.
As you can imagine, my colleagues and I have been having plenty of spirited debates about inflation. One of them sent out this update yesterday morning:

Inflation grew 7.5% versus the 7.3% expectation and December's 7% gain.
Core numbers were up 6% versus the 5.9% expectation and December's 5.5% increase.
Expectations are beginning to build on Wall Street for inflation to peak in the February to March window.
Brokerage firm Morgan Stanley (MS), which has been a bear on stocks, said it anticipates an inflation slowdown while growth surges once more, starting in the second quarter.
So, the "whisper" expectations were for today's CPI number to underwhelm.
That's quite a shift from just one week ago.
The question now is whether that level of conviction can hold for the next couple of months to see whether the numbers really do turn.
I replied:

Mark my words: this is the peak of inflation and associated worries about it.
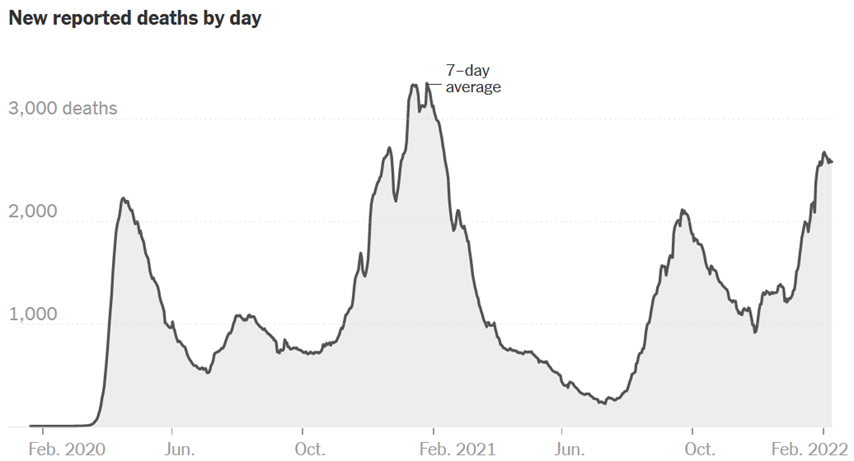
U.S. COVID-19 deaths peaked in the last two weeks of January 2021 (source):


Not surprisingly, everyone was staying home and the economy was very weak.
So it's not at all surprising that year-over-year inflation was high last month, with a white-hot economy comping over that.
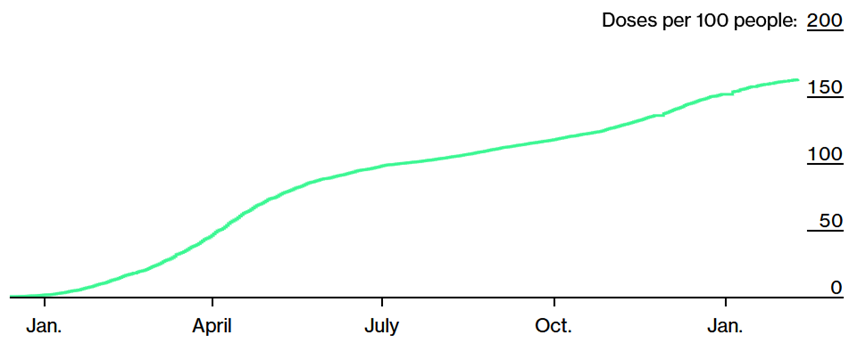
But look at how quickly deaths per day dropped – not coincidentally as vaccinations became widely available. This chart shows cumulative doses per 100 Americans over time, beginning in January 2021 (source):


As the pandemic retreated, the economy took off and has never looked back.
Therefore, the year-over-year inflation comps are going to change radically, starting almost immediately.
By itself – even before you factor in getting supply chains sorted out and other short-term factors – this will bring reported inflation down a lot.
 

marcob77

Moderator


condor74

Forumer attivo
Il Research di ABN-AMRO per aiutarci a capire come la BCE si stia sforzando di comunicare con il mercato...

PS: questa settimana questo thread compie 1 mese. Era un tentativo.
L'idea di fondo era quella di raccogliere voci autorevoli (reports, articoli, newsletters, etc.) che ci aiutassero a seguire (e se possibile a prevedere) l'andamento dei tassi, per scegliere il momento migliore di rientro nel mercato obbligazionario.
A giudicare dal numero modestissimo di contributi, si può solo dedurre che questo interesse è quasi solo mio.
Pertanto con il prossimo weekend il tentativo giungerà a termine..

Anche se non sono (più) un frequentatore assiduo del forum, questa discussione la leggevo volentieri, mi spiacerebbe chiudesse.

Oltre a seguire le voci autorevoli, mi piace guardare direttamente i grafici. Sotto riporto il grafico del TLT (il principale ETF sui treasuries a 20 e 30 anni) giornaliero a tre anni e mensile a 20 anni. Lo stesso faccio con LQD (il principale etf su bond corporate IG). I prezzi si stanno avvicinando a livelli importanti, che hanno sostenuto nel tempo le quotazioni. Questo non significa necessariamente che si sia fatto un bottom, solo che statisticamente, in passato i prezzi che vedete nei grafici hanno retto e da lì si è ripartiti. Potrebbe succedere di nuovo, oppure no, siamo nel regno delle probabilità e dell'arte dei grafici, non della certezze delle scienze esatte. Sono comunque livelli da monitorare per vedere se arrivano segnali che possano far pensare ad una ripresa dei corsi o meno.

1645014158034.png1645014197510.png

1645014158034.png1645014564106.png

Altro elemento da considerare è che i principali gestori monitorati dalla Global Fund Manager Survey di BOFA-ML sono massicciamente sottopesati nei bond, sia sul mese (grafico 14) sia storicamente (a 10 anni, grafico 15). La survey esce ogni mese e si è sempre dimostrata un ottimo indicatore contrarian.

Qui ne trovate una sintesi February 2022 Bank of America Global Fund Manager Survey Results (Summary)

Anche in questo non si deve necessariamente pensare che la discesa sia finita e sia ora di comprare, ma piuttosto che nel medio termine, diciamo da qui a fine anno? i bond dovrebbero aver dato buoni ritorni.
 

Allegati

  • 1645014412728.png
    1645014412728.png
    128,5 KB · Visite: 83
  • 1645014773315.png
    1645014773315.png
    125,2 KB · Visite: 78

Users who are viewing this thread

Alto