frmaoro
il Fankazzista
THE SILVER BULLET | A WORLD WITHOUT SAFE HAVENS
DOWNLOAD
Inflation is always and everywhere a political phenomenon. History shows that governments and voters have had the ultimate say on spending, deficit monetization and debasement of fiat currencies. This has a greater impact on inflation, even before considering the outcomes from monetary aggregates, transmission channels and money velocity.
Today, the tide of politics and policy is turning. After a multi-decade debt super-cycle culminating in a decade of negative real rates, governments are shifting from kick-the-can deflationary policies to fighting inequality, and in turn, possibly secular stagnation. Will they succeed? This the most important question for investors for the current decade, in our view.
We still know little about the Biden administration’s upcoming infrastructure plan and whether it will reverse secular stagnation and raise inflation. However, we do know that the policy discourse has turned globally. We also know that by and large, institutional investors are positioned the wrong way: long paper assets whose valuations are underpinned by low interest rates and low inflation, and underweight assets linked to the real economy. Central bank supported assets – government bonds, investment grade credit, growth stocks – have been the winners over the past decade, attracting most capital flows.
But the past few months have shown that even a slight chance of inflationary policies can result in a violent repricing of yields and interest rate sensitive assets. Some central banks have been fighting against the tide, like the RBA and the ECB. The Fed, however, has told markets that price action in markets is still orderly, implying its put option is now struck lower. If the Fed lets yields climb, as we think it will, towards their fair value of 2.5% in 10 years, then a sharp repricing is due for QE assets. If it leans against the tide, for example with yield curve control, then this would push the Dollar even lower, inflation higher, and impose even more negative real rates for government bondholders.
Investors in nominal, low-yielding assets have only two options: they can lose money slowly, as their return is eroded by inflation – or lose money quickly, if yields reprice faster.
We see a strong opportunity for active strategies that don’t rely on safe haven assets to thrive going forward: capturing macro alpha from volatility and from the cross-country dispersion in the speed of the recovery, as well as micro alpha from investing in sectors which will benefit from an environment of faster growth and inflation.
The end of balanced portfolios?
How can investors rethink portfolio construction in a post-pandemic world? The sharp market adjustments seen over the past few years are challenging many of the traditional pillars of asset allocation. A 60/40 balanced portfolio is unlikely to deliver interesting risk-adjusted returns, since low-but-rising yields will work to invert the historical bond-equity correlation. Rising rates are a necessary consequence of economic reopening, though the pace of the rise will not be as fast as in February. However, rising yields may also be a more structural phenomenon, if the policy mix shifts permanently towards more fiscal stimulus.
60/40 portfolios – no longer as good as it gets
The generally negative correlation between equity and bond prices over the past two decades has been an important pillar of portfolio construction. It is, however, easy to forget that over a longer time horizon such a negative correlation was not the norm, but a rather recent phenomenon: equity-bond correlations were largely positive before late 1990s. Academic research like Andersson et al. (2008) suggests that the changing relationship could be due to inflation and inflation expectations. As we show on the left, equity-bond correlations went up with higher trending inflation and were significantly positive when inflation was above 4%. In other words, when investors were confident that inflation would stay tamed without triggering fast central bank hikes or eroding future returns, government bonds provided a good store of value, or a “safe-haven” in times of market volatility.
But when yields are too low, Treasuries do a bad job of hedging equity risk, so the traditional balanced mix of equities and bonds plays against investors, who can get hit on both sides. During the past 20 years when equity-bond correlation has been negative on average, bottoming yields tend to signal a temporary inversion. This is because increases in yield would start affecting equities, while equity selloffs had a hard time triggering tighter rates. This was the case in 2013 and late 2017, and 2021 may be no exception.
In fact, since March 2020, markets have already experienced two temporary equity corrections –August and October, where S&P was down around 9%. In both cases, Treasury yields barely moved. The acceleration in rates seen in February, conversely, has started affecting equities. Equity valuations point to a similar story. High valuations in growth sectors mean that the 2020 rally has mechanically increased equity duration, i.e. the equity market’s sensitivity to increases in interest rates. Today, the traditional 60/40 portfolio offers the lowest yield and the highest duration risk on record.
Rates – the direction of travel is up
If history and valuations suggest equity markets are vulnerable to further rates increases, the anatomy of recent moves suggests another tantrum selloff may not be far away, for the following reasons.
First, it will gradually become more difficult for equities to cope with the level of yields. The dividend yield on the S&P 500 is ~1.5%, close to the current US 10y yield. More widening will trigger reallocation away from equities from income-seeking investors. Second, the pace of Treasury yield widening has increased. Rates volatility nearly doubled in the second half of February, and it is now at the highest levels since April 2020. Faster rates moves tend to affect equity volatility and levels more markedly. Third, the composition of the increase in rates has worsened. While most of the January increase was due to inflation expectations, the February moves were triggered by higher real rates, which trickle down to risk more easily. With long-term inflation breakevens above 2% and real yields at multi-year lows, further pressure on rates is likely to stem from real yields going forward.
With duration being the key “hidden risk” in investor portfolios, the question is whether pressure on global rates will remain. We think it is likely. Real yields are now c.-0.7%, the lowest level over the past twenty years, previously reached only after the Eurozone crisis in 2012. As the second and third quarter of the year will deliver robust growth, more normalization may take place even in the absence of central banks tightening. Inflation expectations hover at 2%, a robust but not excessive level, likely to be substantially overshot by the April and May CPI prints. The US and UK are in the process of ramping up stimulus, and Europe may follow in 2H21, and this time excess supply will need to be absorbed by markets, as central banks have little reason to increase QE during a rebound.
Central banks will try to control the pace of the widening, and may occasionally trigger relief, but are unlikely to turn the tide. As global growth is rebounding and some inflation is showing in the data, there is no reason to step-up measures to control long-term yields unless market volatility gets out of control. Verbal intervention will anchor the front-end, but steepening pressure is likely to persist. A hawkish turn from major central banks is unlikely before the second half of the year, but a “neutral” stance is historically consistent with real yields around 0.5%, which itself would be sufficient for a further 120bp widening.
US fiscal – infrastructure spending will add fuel to the rates fire
Further pressure on rates will come from US fiscal policy. In early March, the US Congress approved the full version of Biden’s fiscal plan, consisting of $1.9tn in fresh stimulus. As we discussed in our previous Silver Bullet, roughly 50% of the plan is devoted to income-support policies, such as stimulus checks and unemployment support. With US savings rates already hovering at 2.5x pre-covid levels, the plan adds to spending pressure in 2H21, when the US economy should display the quickest pace of re-opening. A stimulus of 10% of GDP is in line with last year, with the key difference that this time investors are left with the burden of buying bonds. In 2021, the US Treasury will issue $2.5tn in new bonds, while the Fed will absorb only $1tn of them. This stands in stark contrast with 2020, when Fed purchases consistently outpaced Treasury issuance. Historically, fiscal expansion without monetary accommodation has lead to curve steepening, for example during 2016-17.
Credit – the sleeping giant
Credit markets have been so far extraordinarily resilient vis a vis the moves in yields. We believe this is thanks to strong macro data as well as central bank support. However, we think credit has the potential for a sudden move weaker later in the year – when central bank support will be challenged by rising inflation pressures in the US, and the flow of positive macro news will gradually ebb.
Credit spreads normally tighten in a positive macro environment. Today, however, they have already been compressed by central bank purchases, and have little room to compensate for a widening in government yields. Adding to the risk of rising yields is the increased duration: US investment grade credit is now over ten years, as issuers extended their maturities over the past few years. The $ iBoxx index has already lost over six percent year to date, due to rising yields.
Higher-yielding bonds are more protected, but their buffer is not large. US high yield debt offers investors ~370bp, which is too little to compensate for a small amount of credit losses as well as a potential 50-100bp widening in yields.
This math easily makes “safe” investment grade credit a losing asset, and risky high yield credit a return-free risk asset, at the benchmark level, which brings us to the next question: will investors stay in? If interest rates continue to rise, flows may reverse. This happened in 2013 and 2018. Since April 15th 2020, global bond markets saw $640bn in inflows from investors, more than 50% of which in IG credit. EM and high yield closed 2020 on net positive inflows, despite sharp outflows in March-April. But a partial unwind of these inflows could compound the moves in rates, pushing credit spreads wider in tandem.
Optimizing portfolio construction in a yield desert
Barbells win in a world without safe havens
A barbelled portfolio between credit and cash offers better risk-reward than a traditional, fully invested credit portfolio. In an environment of QE purchases and record low interest rates, a fully invested credit portfolio provides negatively convex returns to investors. That is, investors receive a small annual coupon at the risk of large drawdowns and an inability to deploy reserve cash during times of stress. With tight spreads and lengthening duration in bonds, even a small widening can wipe out an entire year’s worth of carry. This negative risk-reward is especially clear today, given fragile and volatile markets at high valuations: since the start of QE, extreme events have become more frequent, as shown on the next page. On the other hand, we find that a portfolio barbelled between cash and select BB or B-rated bonds, provides both the same spread as a fully-invested BBB portfolio and the ability to generate excess-returns/alpha by deploying reserve cash during moments of stress.
To demonstrate this, we have created three hypothetical portfolios: a fully invested BBB, a barbell cash/BB and a barbell cash/B. The weights of cash to BB or B are adjusted such that all three portfolios have the same average spread. For the barbell portfolios, we assume that for every 1.2% drawdown in the markets, half of the cash reserves are deployed, i.e. at a 2.4% drawdown, the portfolios would be fully invested in BBs and Bs, respectively. We then re-sell the newly added bonds when the market rises 1.2% from the point of entry. As seen in the chart to the left, the barbelled portfolios outperform over time vs the fully invested BBB portfolio. The outperformance still works for smaller thresholds.
Convertible bonds – better convexity than vanilla credit
Convertible bonds have better risk-reward than vanilla credit. In the last year, the convertible bond market has grown by 50%, to $500bn. Relative to the high yield market at $2.6tn, the convertible market is still small and can grow further. Convertibles offer credit investors better risk-reward than vanilla credit bonds. Put simply: for a given company, on the downside both the convertible and vanilla bonds are pari-passu but while vanilla bonds’ upside is capped, convertible bonds have equity-like upside. Convertibles are usually issued with a lower coupon than vanilla bonds, which has historically put them at a disadvantage to vanilla bonds. However, given record low spreads globally, this lower coupon is now small in absolute terms and well compensated by upside optionality. In 2020, these instruments provided inexpensive exposure to upside in stressed sectors, giving issuers an opportunity to raise funds at a cheap cost and investors significant upside.
Optimising risk-reward is now more important than ever
In a credit portfolio, derivatives can be effectively used to find cheap hedges, enhance the portfolio yield, and capitalize on relative value opportunities. For instance, buying rates options to protect against a rates widening, selling covered calls to enhance yields, and using CDS to capture relative value opportunities either between companies/countries or from curve trades within the same company/country. Ultimately these instruments can help improve the portfolio’s ability to capture upside, protect on the downside and help generate additional alpha-returns. To demonstrate this, we model the return profile of our current portfolio vs a US HY credit ETF for upside / downside moves in the market. As the chart to the left demonstrates, a portfolio built as a barbell of credit and convertible debt, as well as hedges, offers better upside/downside.
Conclusions: the end of paper tigers
How do we define a safe haven asset? It is a store of value, an asset whose price is stable, and that you can trust. We could also say it is an asset whose price should go up when the price of risky assets goes down.
For government debt, this is no longer as true as it was before. On the one hand, the recent price action may be a cyclical event – another interval during a secular bond bull market, which might persist due to structural deflationary trends. But there are reasons to at least doubt this consensus assumption and believe that the move in inflation and rates is the beginning of a more sustained turn.
We draw some structural conclusions from policy communication and price action over the past months:
– The policy mix is shifting to fiscal dominance. We believe the Biden administration will pass a large-scale infrastructure plan in Q2, spanning a multi-decade horizon. Combined with a faster than expected vaccine distribution, we think this will push US GDP to above pre-Covid levels as soon as in Q3. That said, social and geographical inequality will likely remain elevated: as a result, fiscal policy may continue to be proactive in the future. Measures like universal basic income or classic debt monetisation – renamed as modern monetary theory – are becoming increasingly popular.
– Government bonds no longer work as a safe haven. Absent significant inflation, a decade of central bank asset purchases has incentivised strategies based on persistent low volatility and stable correlations. This equilibrium is increasingly unstable, and investors in paper assets which are not in scarce supply increasingly look vulnerable. Even if central banks implement forms of yield curve control, bondholders’ wealth will gradually be eroded by inflation.
– Financial markets have become more fragile, with more frequent sudden stops or flash crash events, which in turn force central banks to intervene. During these crashes, price action has shown the protective effect of risk-free assets ceased to exist. In a deleveraging event – also known as a tantrum – both risky and risk-free assets sell off together. This is not a new phenomenon, however.
– Stable, negative correlations between bonds and risky assets are a relatively recent phenomenon, which was accompanied by decades of stable inflation. Prior to the late nineties, bond-equity correlations were mostly positive. The recent shift in policy may imply a regime shift in correlations, too.
– Traditional portfolio construction and asset allocation may no longer work in this environment. Absent a negatively correlated risk-free asset to balance portfolio risk, the balancing effect of including bonds in a portfolio or in an asset allocation is substantially reduced.
– This means investors need to either rethink which risk-free assets they buy, or rethink their asset allocation, focusing on strategies, which manage risk internally, rather than relying on stable correlations between risky and risk-free assets.
In a world where governments produce an increasing quantity of debt, and central banks are no longer there, traditional long-only bondholders become boiling frogs. Fixed income portfolio construction in this environment is inherently difficult: most asset classes offer little upside vs significant downside.
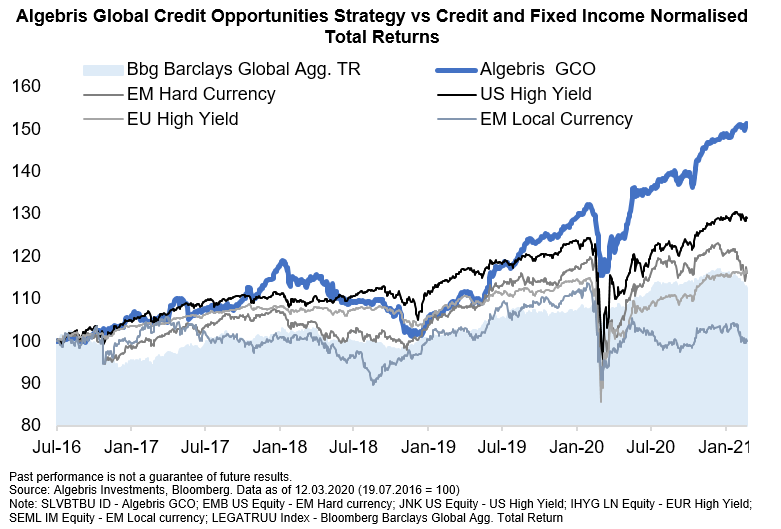
In the Algebris Global Credit Opportunities strategy, we are positioned to gain from a reopening of the economy, from faster spending and rising yields. At the same time, we maintain a large portion of liquidity as well as inexpensive hedges, which will give us room to add back selective yield assets, should volatility rise over the coming months, together with yields – as we expect.
DOWNLOAD
What do rare sneakers, digital art and rookie cards have in common? They are all assets which do not produce cash flows or income. They are also in limited supply, and they have all seen their prices skyrocket recently. Why?You say you want a revolution
Well, you know
We all want to change the world
You tell me that it’s evolution
Well, you know
We all want to change the world
Revolution, The Beatles, 1968
Inflation is always and everywhere a political phenomenon. History shows that governments and voters have had the ultimate say on spending, deficit monetization and debasement of fiat currencies. This has a greater impact on inflation, even before considering the outcomes from monetary aggregates, transmission channels and money velocity.
Today, the tide of politics and policy is turning. After a multi-decade debt super-cycle culminating in a decade of negative real rates, governments are shifting from kick-the-can deflationary policies to fighting inequality, and in turn, possibly secular stagnation. Will they succeed? This the most important question for investors for the current decade, in our view.
We still know little about the Biden administration’s upcoming infrastructure plan and whether it will reverse secular stagnation and raise inflation. However, we do know that the policy discourse has turned globally. We also know that by and large, institutional investors are positioned the wrong way: long paper assets whose valuations are underpinned by low interest rates and low inflation, and underweight assets linked to the real economy. Central bank supported assets – government bonds, investment grade credit, growth stocks – have been the winners over the past decade, attracting most capital flows.
But the past few months have shown that even a slight chance of inflationary policies can result in a violent repricing of yields and interest rate sensitive assets. Some central banks have been fighting against the tide, like the RBA and the ECB. The Fed, however, has told markets that price action in markets is still orderly, implying its put option is now struck lower. If the Fed lets yields climb, as we think it will, towards their fair value of 2.5% in 10 years, then a sharp repricing is due for QE assets. If it leans against the tide, for example with yield curve control, then this would push the Dollar even lower, inflation higher, and impose even more negative real rates for government bondholders.
Investors in nominal, low-yielding assets have only two options: they can lose money slowly, as their return is eroded by inflation – or lose money quickly, if yields reprice faster.
We see a strong opportunity for active strategies that don’t rely on safe haven assets to thrive going forward: capturing macro alpha from volatility and from the cross-country dispersion in the speed of the recovery, as well as micro alpha from investing in sectors which will benefit from an environment of faster growth and inflation.
The end of balanced portfolios?
How can investors rethink portfolio construction in a post-pandemic world? The sharp market adjustments seen over the past few years are challenging many of the traditional pillars of asset allocation. A 60/40 balanced portfolio is unlikely to deliver interesting risk-adjusted returns, since low-but-rising yields will work to invert the historical bond-equity correlation. Rising rates are a necessary consequence of economic reopening, though the pace of the rise will not be as fast as in February. However, rising yields may also be a more structural phenomenon, if the policy mix shifts permanently towards more fiscal stimulus.
60/40 portfolios – no longer as good as it gets
The generally negative correlation between equity and bond prices over the past two decades has been an important pillar of portfolio construction. It is, however, easy to forget that over a longer time horizon such a negative correlation was not the norm, but a rather recent phenomenon: equity-bond correlations were largely positive before late 1990s. Academic research like Andersson et al. (2008) suggests that the changing relationship could be due to inflation and inflation expectations. As we show on the left, equity-bond correlations went up with higher trending inflation and were significantly positive when inflation was above 4%. In other words, when investors were confident that inflation would stay tamed without triggering fast central bank hikes or eroding future returns, government bonds provided a good store of value, or a “safe-haven” in times of market volatility.
But when yields are too low, Treasuries do a bad job of hedging equity risk, so the traditional balanced mix of equities and bonds plays against investors, who can get hit on both sides. During the past 20 years when equity-bond correlation has been negative on average, bottoming yields tend to signal a temporary inversion. This is because increases in yield would start affecting equities, while equity selloffs had a hard time triggering tighter rates. This was the case in 2013 and late 2017, and 2021 may be no exception.
In fact, since March 2020, markets have already experienced two temporary equity corrections –August and October, where S&P was down around 9%. In both cases, Treasury yields barely moved. The acceleration in rates seen in February, conversely, has started affecting equities. Equity valuations point to a similar story. High valuations in growth sectors mean that the 2020 rally has mechanically increased equity duration, i.e. the equity market’s sensitivity to increases in interest rates. Today, the traditional 60/40 portfolio offers the lowest yield and the highest duration risk on record.
Rates – the direction of travel is up
If history and valuations suggest equity markets are vulnerable to further rates increases, the anatomy of recent moves suggests another tantrum selloff may not be far away, for the following reasons.
First, it will gradually become more difficult for equities to cope with the level of yields. The dividend yield on the S&P 500 is ~1.5%, close to the current US 10y yield. More widening will trigger reallocation away from equities from income-seeking investors. Second, the pace of Treasury yield widening has increased. Rates volatility nearly doubled in the second half of February, and it is now at the highest levels since April 2020. Faster rates moves tend to affect equity volatility and levels more markedly. Third, the composition of the increase in rates has worsened. While most of the January increase was due to inflation expectations, the February moves were triggered by higher real rates, which trickle down to risk more easily. With long-term inflation breakevens above 2% and real yields at multi-year lows, further pressure on rates is likely to stem from real yields going forward.
With duration being the key “hidden risk” in investor portfolios, the question is whether pressure on global rates will remain. We think it is likely. Real yields are now c.-0.7%, the lowest level over the past twenty years, previously reached only after the Eurozone crisis in 2012. As the second and third quarter of the year will deliver robust growth, more normalization may take place even in the absence of central banks tightening. Inflation expectations hover at 2%, a robust but not excessive level, likely to be substantially overshot by the April and May CPI prints. The US and UK are in the process of ramping up stimulus, and Europe may follow in 2H21, and this time excess supply will need to be absorbed by markets, as central banks have little reason to increase QE during a rebound.
Central banks will try to control the pace of the widening, and may occasionally trigger relief, but are unlikely to turn the tide. As global growth is rebounding and some inflation is showing in the data, there is no reason to step-up measures to control long-term yields unless market volatility gets out of control. Verbal intervention will anchor the front-end, but steepening pressure is likely to persist. A hawkish turn from major central banks is unlikely before the second half of the year, but a “neutral” stance is historically consistent with real yields around 0.5%, which itself would be sufficient for a further 120bp widening.
US fiscal – infrastructure spending will add fuel to the rates fire
Further pressure on rates will come from US fiscal policy. In early March, the US Congress approved the full version of Biden’s fiscal plan, consisting of $1.9tn in fresh stimulus. As we discussed in our previous Silver Bullet, roughly 50% of the plan is devoted to income-support policies, such as stimulus checks and unemployment support. With US savings rates already hovering at 2.5x pre-covid levels, the plan adds to spending pressure in 2H21, when the US economy should display the quickest pace of re-opening. A stimulus of 10% of GDP is in line with last year, with the key difference that this time investors are left with the burden of buying bonds. In 2021, the US Treasury will issue $2.5tn in new bonds, while the Fed will absorb only $1tn of them. This stands in stark contrast with 2020, when Fed purchases consistently outpaced Treasury issuance. Historically, fiscal expansion without monetary accommodation has lead to curve steepening, for example during 2016-17.
Credit – the sleeping giant
Credit markets have been so far extraordinarily resilient vis a vis the moves in yields. We believe this is thanks to strong macro data as well as central bank support. However, we think credit has the potential for a sudden move weaker later in the year – when central bank support will be challenged by rising inflation pressures in the US, and the flow of positive macro news will gradually ebb.
Credit spreads normally tighten in a positive macro environment. Today, however, they have already been compressed by central bank purchases, and have little room to compensate for a widening in government yields. Adding to the risk of rising yields is the increased duration: US investment grade credit is now over ten years, as issuers extended their maturities over the past few years. The $ iBoxx index has already lost over six percent year to date, due to rising yields.
Higher-yielding bonds are more protected, but their buffer is not large. US high yield debt offers investors ~370bp, which is too little to compensate for a small amount of credit losses as well as a potential 50-100bp widening in yields.
This math easily makes “safe” investment grade credit a losing asset, and risky high yield credit a return-free risk asset, at the benchmark level, which brings us to the next question: will investors stay in? If interest rates continue to rise, flows may reverse. This happened in 2013 and 2018. Since April 15th 2020, global bond markets saw $640bn in inflows from investors, more than 50% of which in IG credit. EM and high yield closed 2020 on net positive inflows, despite sharp outflows in March-April. But a partial unwind of these inflows could compound the moves in rates, pushing credit spreads wider in tandem.
Optimizing portfolio construction in a yield desert
Barbells win in a world without safe havens
A barbelled portfolio between credit and cash offers better risk-reward than a traditional, fully invested credit portfolio. In an environment of QE purchases and record low interest rates, a fully invested credit portfolio provides negatively convex returns to investors. That is, investors receive a small annual coupon at the risk of large drawdowns and an inability to deploy reserve cash during times of stress. With tight spreads and lengthening duration in bonds, even a small widening can wipe out an entire year’s worth of carry. This negative risk-reward is especially clear today, given fragile and volatile markets at high valuations: since the start of QE, extreme events have become more frequent, as shown on the next page. On the other hand, we find that a portfolio barbelled between cash and select BB or B-rated bonds, provides both the same spread as a fully-invested BBB portfolio and the ability to generate excess-returns/alpha by deploying reserve cash during moments of stress.
To demonstrate this, we have created three hypothetical portfolios: a fully invested BBB, a barbell cash/BB and a barbell cash/B. The weights of cash to BB or B are adjusted such that all three portfolios have the same average spread. For the barbell portfolios, we assume that for every 1.2% drawdown in the markets, half of the cash reserves are deployed, i.e. at a 2.4% drawdown, the portfolios would be fully invested in BBs and Bs, respectively. We then re-sell the newly added bonds when the market rises 1.2% from the point of entry. As seen in the chart to the left, the barbelled portfolios outperform over time vs the fully invested BBB portfolio. The outperformance still works for smaller thresholds.
Convertible bonds – better convexity than vanilla credit
Convertible bonds have better risk-reward than vanilla credit. In the last year, the convertible bond market has grown by 50%, to $500bn. Relative to the high yield market at $2.6tn, the convertible market is still small and can grow further. Convertibles offer credit investors better risk-reward than vanilla credit bonds. Put simply: for a given company, on the downside both the convertible and vanilla bonds are pari-passu but while vanilla bonds’ upside is capped, convertible bonds have equity-like upside. Convertibles are usually issued with a lower coupon than vanilla bonds, which has historically put them at a disadvantage to vanilla bonds. However, given record low spreads globally, this lower coupon is now small in absolute terms and well compensated by upside optionality. In 2020, these instruments provided inexpensive exposure to upside in stressed sectors, giving issuers an opportunity to raise funds at a cheap cost and investors significant upside.
Optimising risk-reward is now more important than ever
In a credit portfolio, derivatives can be effectively used to find cheap hedges, enhance the portfolio yield, and capitalize on relative value opportunities. For instance, buying rates options to protect against a rates widening, selling covered calls to enhance yields, and using CDS to capture relative value opportunities either between companies/countries or from curve trades within the same company/country. Ultimately these instruments can help improve the portfolio’s ability to capture upside, protect on the downside and help generate additional alpha-returns. To demonstrate this, we model the return profile of our current portfolio vs a US HY credit ETF for upside / downside moves in the market. As the chart to the left demonstrates, a portfolio built as a barbell of credit and convertible debt, as well as hedges, offers better upside/downside.
Conclusions: the end of paper tigers
How do we define a safe haven asset? It is a store of value, an asset whose price is stable, and that you can trust. We could also say it is an asset whose price should go up when the price of risky assets goes down.
For government debt, this is no longer as true as it was before. On the one hand, the recent price action may be a cyclical event – another interval during a secular bond bull market, which might persist due to structural deflationary trends. But there are reasons to at least doubt this consensus assumption and believe that the move in inflation and rates is the beginning of a more sustained turn.
We draw some structural conclusions from policy communication and price action over the past months:
– The policy mix is shifting to fiscal dominance. We believe the Biden administration will pass a large-scale infrastructure plan in Q2, spanning a multi-decade horizon. Combined with a faster than expected vaccine distribution, we think this will push US GDP to above pre-Covid levels as soon as in Q3. That said, social and geographical inequality will likely remain elevated: as a result, fiscal policy may continue to be proactive in the future. Measures like universal basic income or classic debt monetisation – renamed as modern monetary theory – are becoming increasingly popular.
– Government bonds no longer work as a safe haven. Absent significant inflation, a decade of central bank asset purchases has incentivised strategies based on persistent low volatility and stable correlations. This equilibrium is increasingly unstable, and investors in paper assets which are not in scarce supply increasingly look vulnerable. Even if central banks implement forms of yield curve control, bondholders’ wealth will gradually be eroded by inflation.
– Financial markets have become more fragile, with more frequent sudden stops or flash crash events, which in turn force central banks to intervene. During these crashes, price action has shown the protective effect of risk-free assets ceased to exist. In a deleveraging event – also known as a tantrum – both risky and risk-free assets sell off together. This is not a new phenomenon, however.
– Stable, negative correlations between bonds and risky assets are a relatively recent phenomenon, which was accompanied by decades of stable inflation. Prior to the late nineties, bond-equity correlations were mostly positive. The recent shift in policy may imply a regime shift in correlations, too.
– Traditional portfolio construction and asset allocation may no longer work in this environment. Absent a negatively correlated risk-free asset to balance portfolio risk, the balancing effect of including bonds in a portfolio or in an asset allocation is substantially reduced.
– This means investors need to either rethink which risk-free assets they buy, or rethink their asset allocation, focusing on strategies, which manage risk internally, rather than relying on stable correlations between risky and risk-free assets.
In a world where governments produce an increasing quantity of debt, and central banks are no longer there, traditional long-only bondholders become boiling frogs. Fixed income portfolio construction in this environment is inherently difficult: most asset classes offer little upside vs significant downside.
In the Algebris Global Credit Opportunities strategy, we are positioned to gain from a reopening of the economy, from faster spending and rising yields. At the same time, we maintain a large portion of liquidity as well as inexpensive hedges, which will give us room to add back selective yield assets, should volatility rise over the coming months, together with yields – as we expect.
")